Best Shopify reporting apps
 By Le Thi Hien · Updated November 2026 · 15 min read
Shopify already ships sales, profit and inventory reports, and the Basic plan includes custom reports. A reporting app earns its place when you need something those reports don't give you: a spreadsheet view, reports sent on a schedule, or someone to build a report for you. Below, Shopify's own reports are the baseline and three apps are compared against them, from their public listings.
Comparison
| Feature | Shopify built-in reports | Mixtable Analytics Spreadsheet | BR - Better Reports | Report Pundit: Custom Reports |
|---|---|---|---|---|
| Lowest price | Included with your Shopify plan; the Basic plan comes with access to all reports | Free for stores under 1,000 lifetime orders, the same feature list as the paid plans | US$19.90/ | Free for stores below 1,000 lifetime orders |
| Paid plans | None | Basic US$15/ | Basic US$19.90, Grow US$39.90, Advanced US$149.90, Plus US$299.90 a month | Basic US$9, Grow US$19, Advanced US$35 a month |
| Free plan or trial | Part of your Shopify plan | Free plan; 7-day trial on paid plans | No free plan; 14-day trial | Free plan; 14-day trial on paid plans |
| Sales reports | Total sales by product, variant, vendor, sales channel, discount code and more | By vendor, market and customer segment | Yes | Among 150 pre-built reports |
| Product margin or profit | Gross profit by product and variant, profit margin by order; needs a cost per item | Profit and margin beside every product, on every plan | COGS tracking and profit insights, in its listing tags | Profit reports; COGS tracking in its listing tags |
| Inventory reports | Month-end inventory value, sell-through rate, ABC analysis, days of inventory remaining | Stock in the sheet; days of stock left per variant in a listing picture | Yes | Yes |
| Custom reports | Edit a report's filters, columns and dates and save it, start from an empty exploration, or ask Sidekick | Ready-made reports in a spreadsheet, your own formulas and pivot tables | Custom fields, metrics and formulas on every plan, or the team builds the report free | Limited setup on Free; unlimited from Basic, US$9/ |
| Exports and scheduling | CSV, XML, JSONL or Parquet for most reports; scheduling not on the help pages we read | Excel with formulas, or CSV; scheduling not on its listing | PDF, Excel, CSV, Google Sheets; scheduled reports by email or to Google Sheets, every plan | Free: Excel and CSV. Scheduling from Basic, US$9/ |
| App Store rating and reviews | Not an app | No reviews yet | 5.0 from 1,201 reviews | 5.0 from 2,076 reviews |
| Built for Shopify badge | Not an app | Not on its listing | Not on its listing | Not on its listing |
Shopify's column comes from Shopify's help pages; the three app columns come from each app's Shopify App Store listing, all read 19 Nov 2026. A tick means the listing names the feature without naming a plan. A cross means the listing does not show it, which is not proof the app lacks it. All three apps price by the Shopify plan your store is on. Prices are in US dollars as listed.
At a glance
| Option | Best for | First paid plan | Free plan | App rating and reviews |
|---|---|---|---|---|
| Shopify built-in reports | Sales, profit and inventory reports in your admin | None, included with your Shopify plan | Part of your Shopify plan | Not an app |
| Mixtable Analytics Spreadsheet | Store owners who work in spreadsheets | US$15/ | Yes, under 1,000 lifetime orders | No reviews yet |
| BR - Better Reports | Scheduled reports and a free report building service | US$19.90/ | No, a 14-day trial | 5.0 from 1,201 reviews |
| Report Pundit: Custom Reports | Scheduled reports at a low monthly price | US$9/ | Yes, below 1,000 lifetime orders | 5.0 from 2,076 reviews |
Most small stores should start with Shopify's own reports. Sales, gross profit by product and inventory value are already there, and you can save your own version of any report on the Basic plan. Add an app when a specific job keeps costing you time.
- Mixtable Analytics Spreadsheet suits a store owner who thinks in spreadsheets and wants profit beside every product in one sheet. It is new, with no reviews yet.
- BR - Better Reports suits a team that wants reports sent to email or Google Sheets on a schedule and is happy to pay from US$19.90 a month for it.
- Report Pundit suits a store that wants scheduled reports at the lowest paid price here (US$9 a month on the Basic plan) or a free start below 1,000 lifetime orders.
What we looked at
- Sales, margins and inventory. What each option reports out of the box, and what a margin figure needs behind it: a cost per item.
- Custom reports. Whether you build them yourself, with filters, formulas and pivot tables, or the vendor builds them for you.
- Exports and scheduling. The file types, Google Sheets, and whether a report can reach your inbox every week without anyone opening the app.
- Price by Shopify plan. All three apps charge by the Shopify plan your store is on, so the same app can cost several times as much on a bigger plan.
- What the app's own users say. Its rating on the App Store, how many stores reviewed it, and how the stars split.
Reports often lead to bulk changes. A margin report shows which prices to raise, an inventory report shows which products to archive, and the fix is a bulk edit across hundreds of products. Back up your store before you make that edit. Shopify runs the platform; your product data is yours to protect, and a backup app such as TinyBackup keeps a copy you can restore from if a bulk change goes wrong.
The four options
Shopify's own reports come first as the baseline, then the three apps from the fewest reviews to the most. Under each app picture, "Reviews on the listing" counts the reviews stores wrote about that app on the Shopify App Store.
Shopify built-in reports
Shopify groups its default reports into 11 categories, including Sales, Profit and Inventory. Profit reports only count products and variants that had a cost recorded when they sold, so add a cost per item to your products first. The Inventory remaining per product report shows days of inventory remaining. You can export most reports as CSV, XML, JSONL or Parquet. The help pages we read don't describe scheduled or emailed reports.
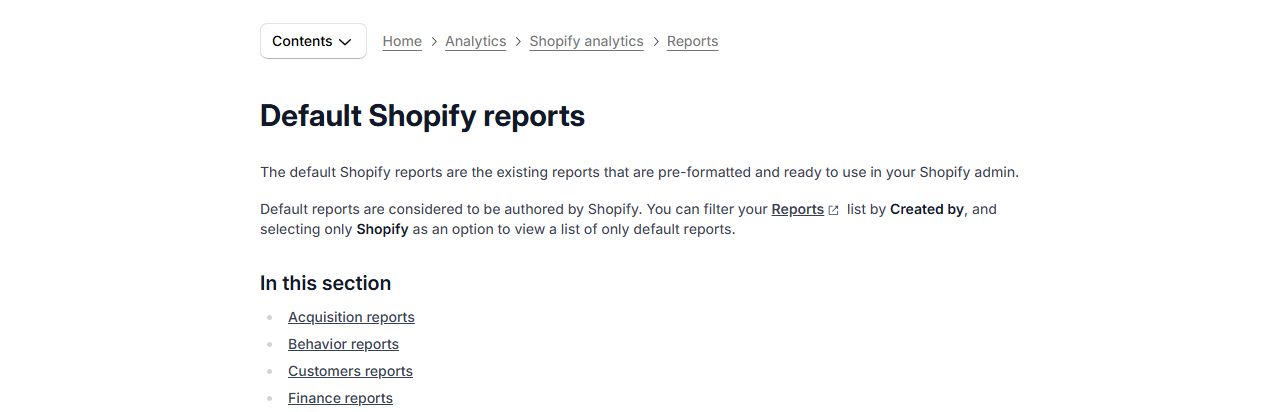
Every store, as the first place to look. Sales by product, gross profit by product and variant, and month-end inventory value are already in your admin.
Profit reports need a cost per item on each product and variant, and only count sales made after the cost was recorded. The help pages we read describe exporting reports, not sending them on a schedule.
Source: Shopify Help Center, default reports
Mixtable Analytics Spreadsheet
Mixtable puts your store data in an Excel-like sheet that the listing says updates as orders come in. It measures net sales, margin, returns, marketing attribution and customer lifetime value, and each metric gets its own time period and filters, such as country or sales channel. Every plan has the same features: ready-made reports by vendor and market, pivot tables, profit and margin beside every product, and export to Excel with formulas or CSV. It has been on the App Store since November 2024, works with the Shopify admin and shows English only.
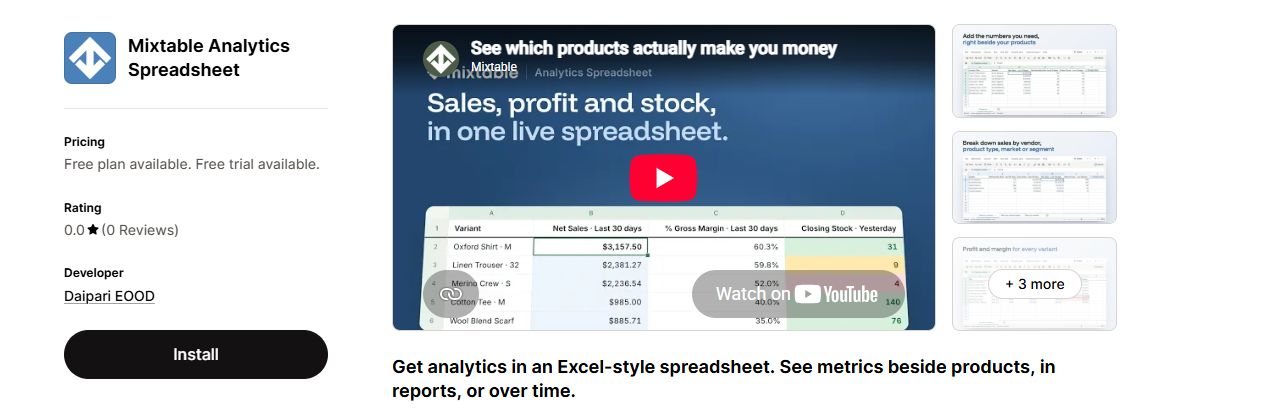
A store owner who works in spreadsheets and wants net sales, margin and stock beside each product, with numbers that update as orders come in.
It has no reviews yet, and the listing names neither scheduled reports nor Google Sheets. It shows profit and margin but does not say where the cost behind them comes from.
Listing: Mixtable Analytics Spreadsheet on the Shopify App Store
BR - Better Reports
Better Reports has been listed since February 2017 and, its listing says, reads tags, metafields and attributes as well as orders. Every plan includes custom reports and fields, scheduled reports by email or to Google Sheets, export to PDF, Excel, CSV and Google Sheets, and a free service where the team builds a report for you. The listing also names multiple chart visuals, POS support, multi-store reporting and multi-currency, and lists Email, Excel and Google Sheets, Google Drive, POS and Stripe under works with. It shows English only.
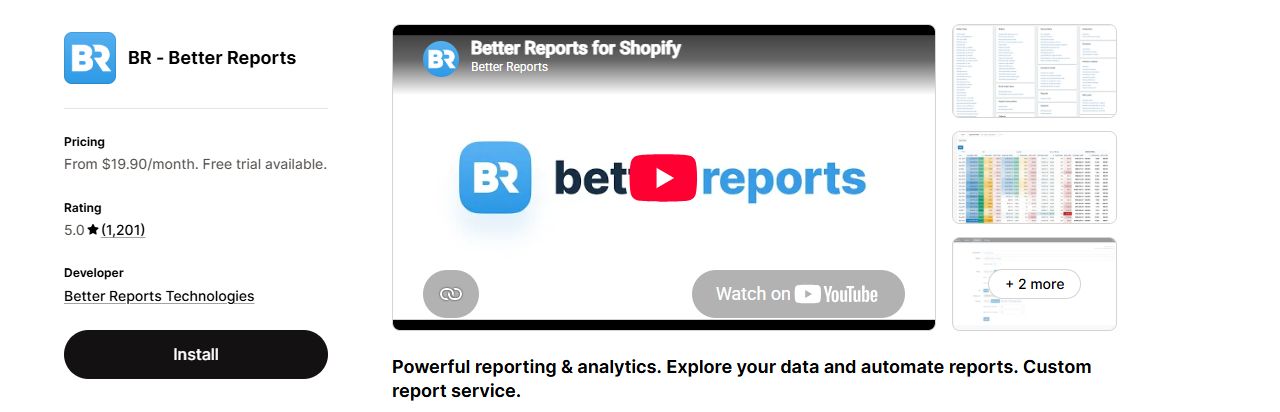
A team that wants reports in its inbox or a Google Sheet on a schedule, or wants the vendor to build a report it can't build itself.
There is no free plan, and the price follows your Shopify plan: the same features cost US$19.90 a month on Basic and US$299.90 on Plus.
Listing: BR - Better Reports on the Shopify App Store
Report Pundit: Custom Reports
Report Pundit lists 150 pre-built reports, from sales and refunds to tax and inventory, with filters, calculated columns and data from metafields, tags and line items. It has been on the App Store since August 2019, and the listing says you can also analyze your store data in Claude and ChatGPT through MCP. It lists GA4, Google Ads, Meta Ads and POS under works with and shows English only. The free plan covers stores below 1,000 lifetime orders; paid plans add charts, scheduling, free report setup and multi-store reports, step by step.
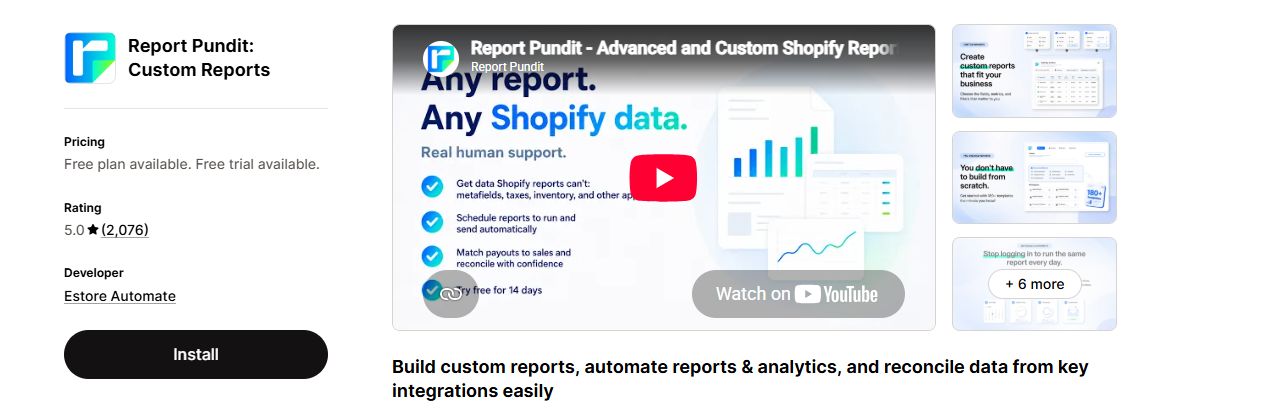
A store that wants scheduled reports at a low monthly price, or a free start below 1,000 lifetime orders.
The listing names PDF, Slack and Google Sheets exports without tying them to a plan, and its plan cards stop at Advanced, with no Shopify Plus price.
Listing: Report Pundit: Custom Reports on the Shopify App Store
Check which Shopify plan your store is on before you compare prices. All three apps charge by it, so the same app costs a different amount on each plan: Better Reports runs from US$19.90 a month on Basic to US$299.90 on Plus, Mixtable from US$15 to US$49, and Report Pundit's plan cards from US$9 on Basic to US$35 on Advanced. Mixtable is the only one of the three whose listing shows a yearly price.
How to choose a reporting app
Start with Shopify's own reports and note the one job they don't do for you. Then answer the questions below and use the tables to cut the three apps down to one worth a trial.
Questions to ask first
- Sales: if the default sales reports answer your questions, stay on Shopify.
- Margins: enter a cost per item first. Shopify's profit reports need it, and an app's profit column is only as good as the cost data behind it.
- Inventory: Shopify covers month-end value, sell-through and days of inventory remaining per product. Mixtable's listing shows days of stock left per variant.
- Custom reports: try Shopify's saved custom reports before paying. Pay when you need metafields, formulas or someone to build the report.
- Exports: if you need a report in your inbox or a Google Sheet every week, Better Reports and Report Pundit list scheduling. Mixtable's listing does not.
Which option for which store
| Your store | Pick | Why |
|---|---|---|
| Needs sales, profit and inventory reports | Shopify built-in reports | Included with your plan; the Basic plan comes with access to all reports, custom reports included. |
| Works in spreadsheets | Mixtable | Profit and margin beside every product, pivot tables and your own formulas in a live sheet; free under 1,000 lifetime orders. |
| Wants a report emailed every week | Report Pundit or Better Reports | Both list scheduled reports; Report Pundit from US$9/ |
| Wants someone else to build a custom report | Better Reports or Report Pundit | Better Reports lists a free custom report service on every plan; Report Pundit lists free custom report setup from Grow, US$19/ |
| Runs several stores or Markets | Report Pundit or Better Reports | Report Pundit Advanced, US$35/ |
| Has under 1,000 lifetime orders | Shopify, then Mixtable or Report Pundit | Both apps have a free plan for stores below 1,000 lifetime orders. |
Features side by side
| Feature | Shopify built-in reports | Mixtable | Better Reports | Report Pundit |
|---|---|---|---|---|
| Free to start | Included in your Shopify plan | Yes | Not on its listing | Yes |
| Sales reports | Yes | Yes | Yes | Yes |
| Profit or margin | Yes | Yes | Yes | Yes |
| Inventory or stock | Yes | Yes | Yes | Yes |
| CSV export | Yes | Yes | Yes | Yes |
| Excel export | CSV, XML, JSONL or Parquet | Yes | Yes | Yes |
| PDF or Google Sheets export | Not in the help pages we read | Not on its listing | Yes | Yes |
| Scheduled reports | Not in the help pages we read | Not on its listing | Yes | Yes |
| Help building a report | Ask Sidekick | Not on its listing | Yes | Yes |
A tick means Shopify's help pages or the app's listing name the feature, in its feature lists, plans, tags or description; a cross means the listing does not, which is not proof the app lacks it. Read 19 Nov 2026. Some features sit on a paid plan: Report Pundit's scheduling starts on Basic and its free report setup on Grow, and Better Reports' profit appears in its listing tags.
Plans and prices side by side
| Option | Free start | Lowest paid plan | Highest paid plan | Trial | Yearly price |
|---|---|---|---|---|---|
| Shopify built-in reports | Included in your Shopify plan | None | None | Part of your Shopify plan | Not an app |
| Mixtable | Free under 1,000 lifetime orders | Basic, US$15/ | Shopify Plus, US$49/ | 7 days | US$144 to US$470 a year, 20% less |
| Better Reports | None | Basic, US$19.90/ | Plus, US$299.90/ | 14 days | Not shown |
| Report Pundit | Free below 1,000 lifetime orders | Basic, US$9/ | Advanced, US$35/ | 14 days | Not shown |
Prices in US dollars as each listing shows them, read 19 Nov 2026. Each app's plan follows the Shopify plan your store is on. Report Pundit's plan cards stop at Advanced and show no Shopify Plus price.
Why this one, not that one
- Shopify first for profit. Gross profit by product and variant is already in the default reports once each product has a cost per item. An app adds margin beside every product in one sheet (Mixtable) or profit reports you can schedule (Report Pundit).
- Mixtable or Report Pundit for a free start. Both are free for stores under 1,000 lifetime orders. Mixtable's free plan has the same feature list as its paid plans; Report Pundit's has limited report setup and Excel and CSV export, with scheduling from Basic.
- Report Pundit or Better Reports for scheduled reports. Both list them. Report Pundit's Basic costs US$9 a month against Better Reports' US$19.90 on the same Shopify plan, and Better Reports includes its free custom report service on every plan, where Report Pundit adds free setup from Grow.
- Mixtable or Better Reports for a spreadsheet way of working. Mixtable is a live sheet with formulas and pivot tables. Better Reports lists custom fields, metrics and formulas, and sends reports to Google Sheets.
Before you trust any margin figure, open a few products and check the cost per item field. Shopify's profit reports only count products and variants that had a cost recorded when they sold, so a missing cost shows up as missing profit. Fill in your costs first, then compare Shopify's profit report with an app's trial on the same month.
Back up your store before a bulk change your reports point to
TinyBackup automatically backs up key Shopify store data and helps you restore from a previous backup.
Start free trialHow we compared
Every fact on this page comes from each app's public Shopify App Store listing and from Shopify's help pages, read on 19 Nov 2026; the three listings were read again that day, and the pictures, review numbers and plan cards come from that second read. We did not install or run any of these apps or Shopify's reports for this comparison; what the apps do is what their listings say. The ratings and review counts are what stores gave each app on the App Store. Prices and review counts change, so check the listing before you install.